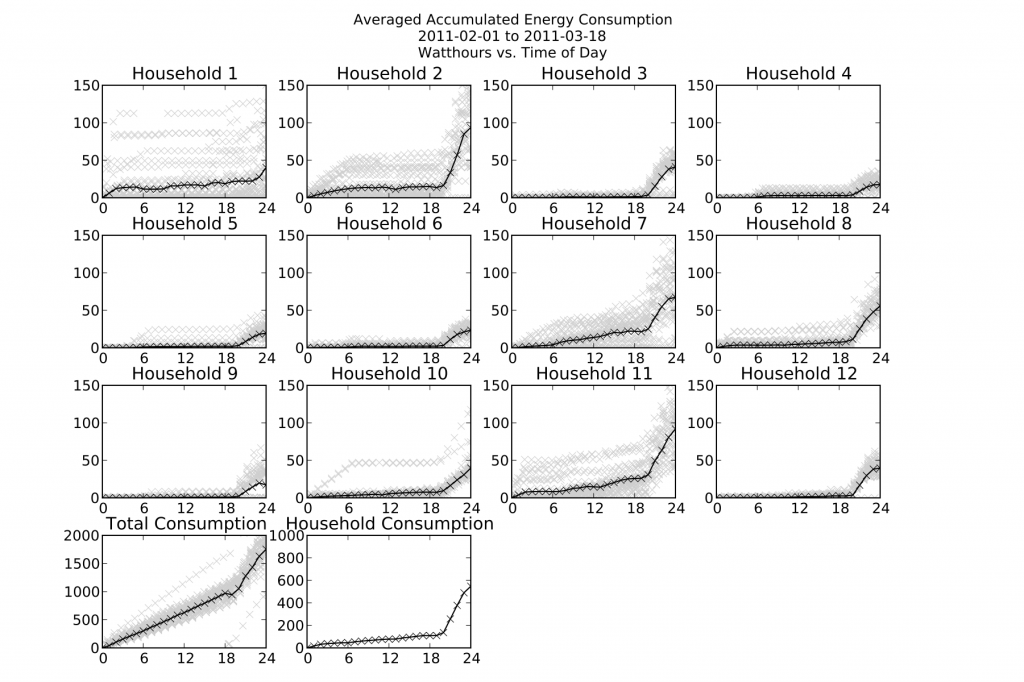
We have been receiving data from the pilot site for a few months now and are able to look at the consumption patterns of our customers. The plot shown is the accumulated energy consumption for that day. The black line is a binned average for each hour. The slope of the black line is the average power. This shows that our customers primarily use electricity during the evening hours, which presents a challenge for a solar system and necessitates a battery system. The low consumption customers (< 50W) only own lightbulbs while other customers have entertainment appliances such as televisions or radios. Many are also using cellphone chargers.
Data from pilot site
Leave a Reply

