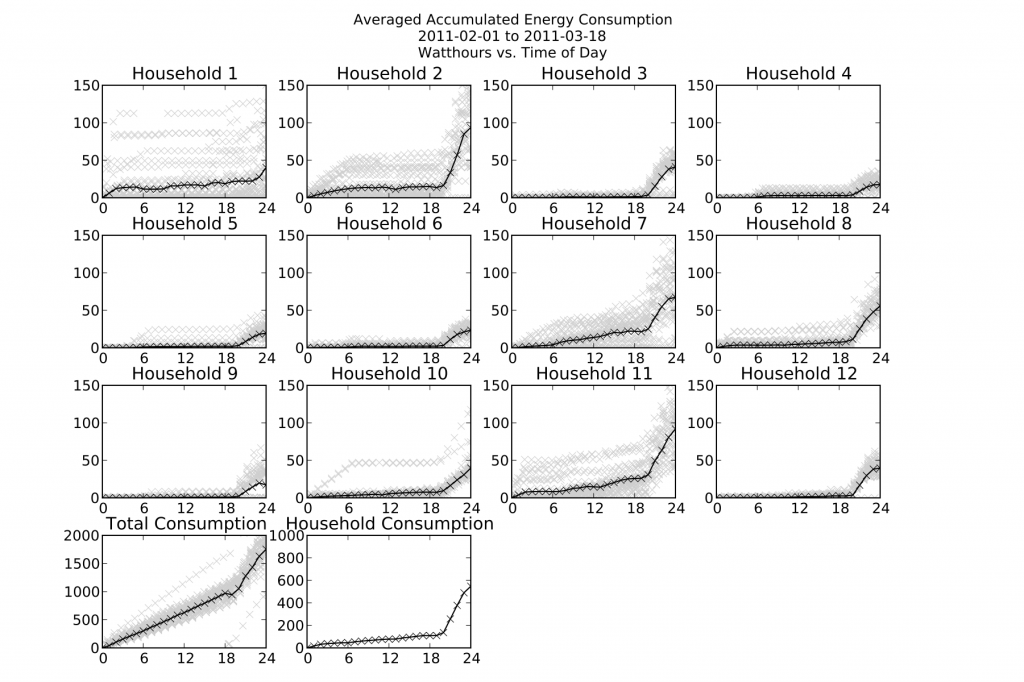
We have been receiving data from the pilot site for a few months now and are able to look at the consumption patterns of our customers. The plot shown is the accumulated energy consumption for that day. The black line is a binned average for each hour. The slope of the black line is the average power. This shows that our customers primarily use electricity during the evening hours, which presents a challenge for a solar system and necessitates a battery system. The low consumption customers (< 50W) only own lightbulbs while other customers have entertainment appliances such as televisions or radios. Many are also using cellphone chargers.
Day 16: Organization
Enclosure Fabrication Tools
SharedSolar Meter Assembly Lab – Video Tour
Here is a really quick video tour of the assembly lab. As you can see, we just got a shipment of enclosures and other goodies, hence the stacks of boxes. Yes it’s full. Yes it’s a little messy now. Yes Justin is trying to smile even though it’s late and we’re both still here. But this is where the magic will happen, soon enough. Stay tuned for more (admittedly low quality) video updates from the assembly lab.
Electronics cabin construction nearing completion (Uganda)
The electronics cabin in Ruhiira is nearly complete!


